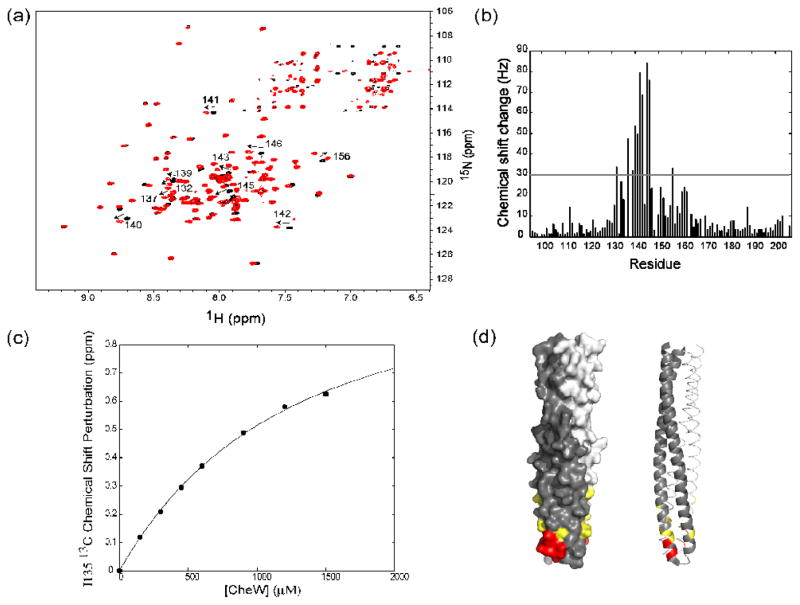
Figure 4.
The interaction of TM001490–206 with the coupling protein CheW. (a) A superimposition of 1H-15N TROSY HSQC spectra of TM001490–206 (black) and TM001490–206 in the presence of CheW (red). Large chemical-shift changes (indicated by arrows), are seen in the tip region of the receptor (residues 132, 137, 139, 140, 141, 142, 143, 145, 146, and 156). (b) Measured combined chemical shifts changes in the presence of CheW plotted as a function of residue number for TM001490–206. (c) Changes in chemical shift of TM001490–206 as a function of CheW concentration. The calculated binding curve is shown for residue 135 with best-fit dissociation constant of 1200 μM. (d) Mapping of the residues of TM001490–206 perturbed upon binding of CheW on the structure TM001490–206. Residues with chemical shifts larger than 50 Hz are shown in red; those with shifts between 30 and 50 Hz are shown in yellow.

