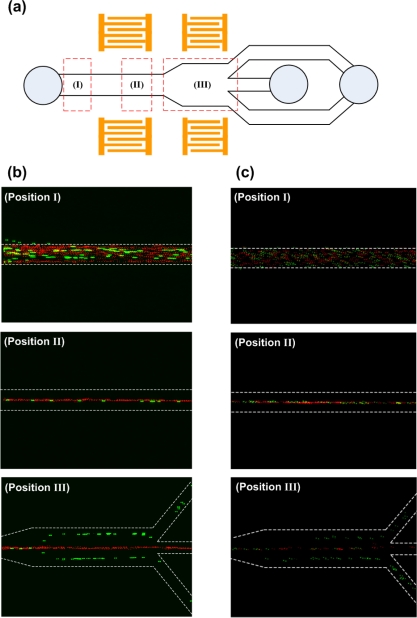
Figure 8.
(a) The chosen location (I–III) in the test section for recording the fluorescent images of the each particle stream; (b) Fluorescent images of 10 μm (green) and 3 μm (red) particles distribution. Constant operating frequency of 13.2 MHz, input power of 1 W, flow rate of 0.5 μL/min, and particle concentration of 1% by volume were applied; (c) Fluorescent images of 5 μm (green) and 3 μm (red) particles distribution. Constant operating frequency of 13.2 MHz, input power of 1.45 W, flow rate of 0.2 μL/min, and particle concentration of 1% by volume were applied.

