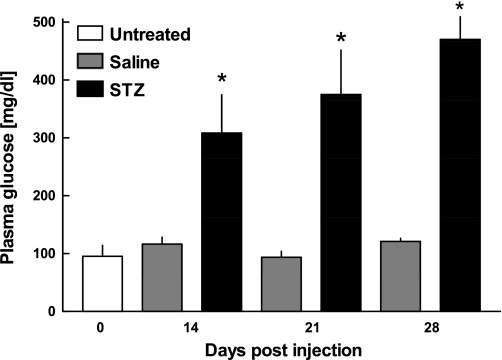
Fig. 1.
Plasma glucose levels of untreated mice (open bars; n = 5), saline-treated mice (gray bars; n = 6 at day 14, n = 6 at day 21, and n = 5 at day 28), and STZ-treated diabetic mice (filled bars; n = 6 at day 14, n = 4 at day 21, and n = 11 at day 28) at different time points after STZ or saline injection. Glucose values exceeding the upper detection limit (600 mg/dl) were considered equal to 600 mg/dl. Data are presented as means ± SE. *P < 0.001 vs. untreated mice.

