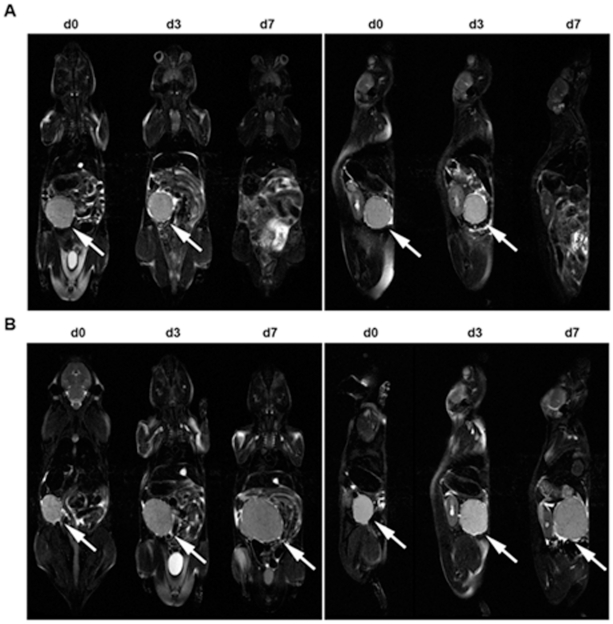
Figure 4. MR imaging.
MR images of one mouse each of the therapy (A, imatinib) and placebo group (B). Coronar (left panels) and sagittal (left panels) T2 images of EOL-1 bearing scid mice on days 27 (d0 of treatment), 30 (d3 of treatment) and 34 (d7 of treatment). In the selected plane, remission (therapy) or growth (placebo) of a large abdominal chloroma can be observed (arrows). Chloroma is in complete remission on day 34 under imatinib treatment (A, d7).

