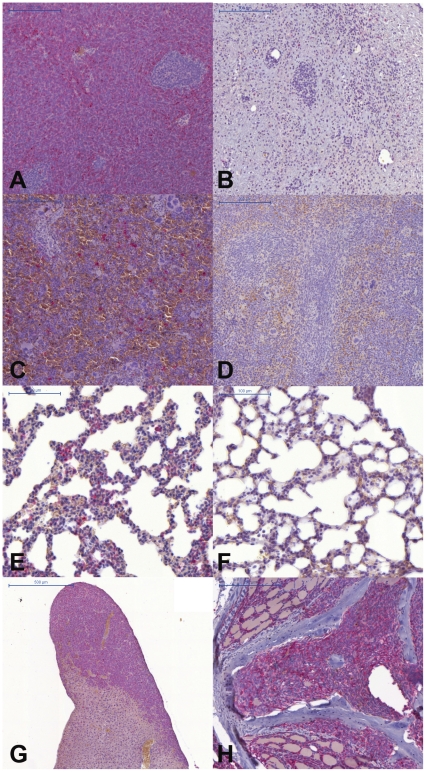
Figure 5. Histology.
The presence of human EOL-1 cells was ascertained by labeling for human HLA-DR (seen in red) in tissue-sections. (A) chloroma, placebo group; (B) former chloroma, therapy group with no viable EOL-1 cells detectable; (C) spleen, placebo; (D) spleen, therapy, with no detectable EOL-1 cells; (E) lung, placebo; (E) lung, therapy, with no detectable EOL-1 cells; (F) liver, placebo, massive EOL-1 infiltrates; (G) spine, placebo, with EOL-1 infiltrates in bone marrow.

