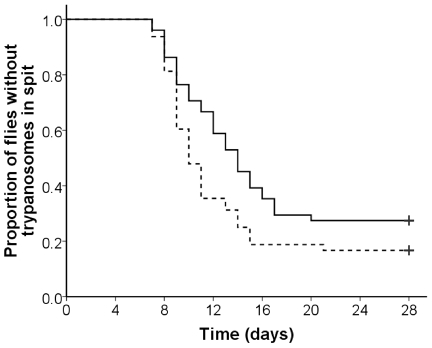
Figure 2. Sex difference in first appearance of trypanosomes in spit samples.
Comparison of individually caged male (dotted line) and female (black line) G. m. morsitans infected with T. b. brucei J10; infected feed was supplemented with N-acetyl-glucosamine. The data from two replicate experiments, each including male and female flies are displayed as a Kaplan Meier survival plot (males: n = 40; females: n = 37). Vertical ticks indicate points after which flies were not sampled in experiments 1 (day 18) and 2 (day 28) (censored data). Female flies were significantly slower in producing trypanosome positive spit samples than males (P<0.05).

