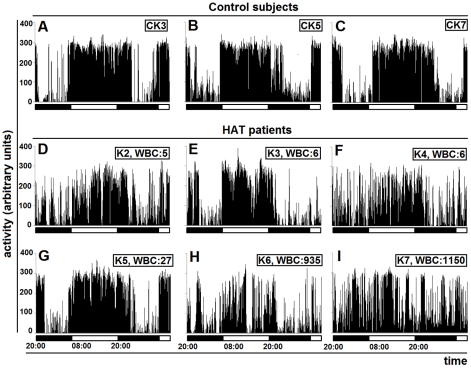
Figure 5. Actigrams of DRC adult patients before treatment.
Actigrams are 36-h long and are those from the adult control subjects CK3, CK5, CK7 (A–C) and patients K2–K7 at admission (D–I). The horizontal bars indicate the light and dark periods. WBC: white blood cell counts in the cerebrospinal fluid.

