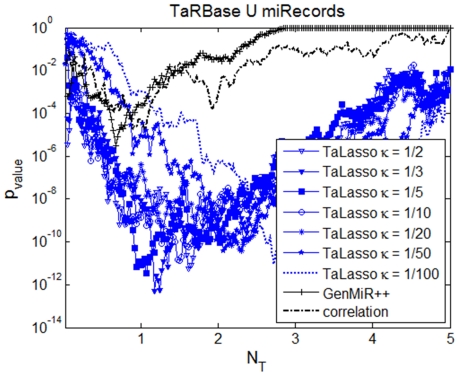
Figure 4. Enrichment on experimentally-validated targets for LDS dataset.
For each value of the tuning factor and different number of predicted interactions, the figure shows the probability of drawing the predicted number of experimentally-validated targets by using a hypergeometric test. The figure shows TaLasso enrichment results for different κG values (in blue), compared to the enrichment values of GenMiR++ (black crosses) and Pearson Correlation (black dashed).

