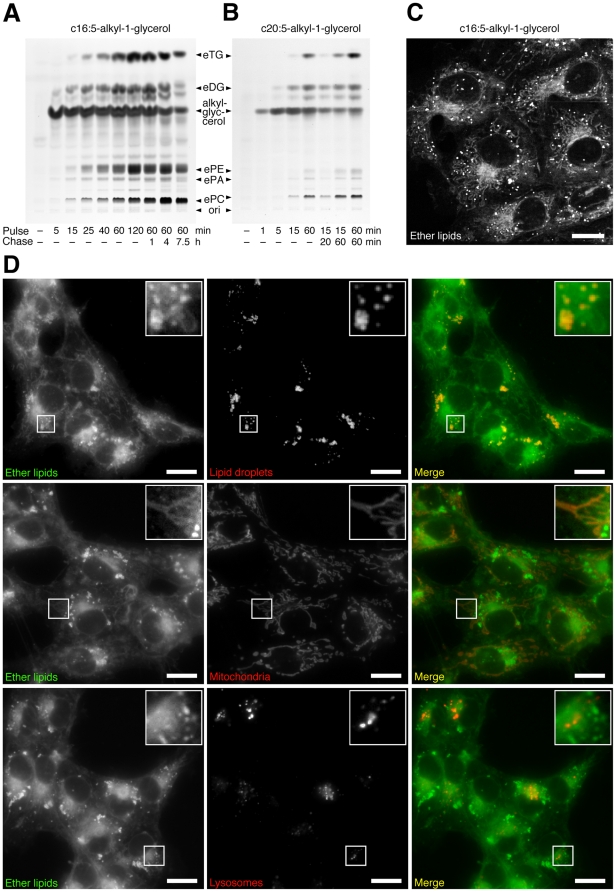
Figure 2. Metabolism and intracellular distribution of polyene-alkyl-glycerols in COS7 cells.
Cells were incubated with 50 µM of c16:5-alkyl-glycerol (A, C, D) or c20:5-alkyl-glycerol (B) for different pulse times (A & B), 2 h (C) or 0.5 h (D). Cellular lipids were extracted and analyzed by TLC for fluorescent metabolites, which were identified by comigrating lipid standards (A & B). Living cells were imaged using two-photon-excitation microscopy (C) or epifluorescence microscopy (D). Merged color images show ether lipids in green and LDs, mitochondria, or lysosomes stained by LD540, Mitotracker, or Lysotracker, respectively, in red (D). Bars, 20 µm. ori, origin of application.

