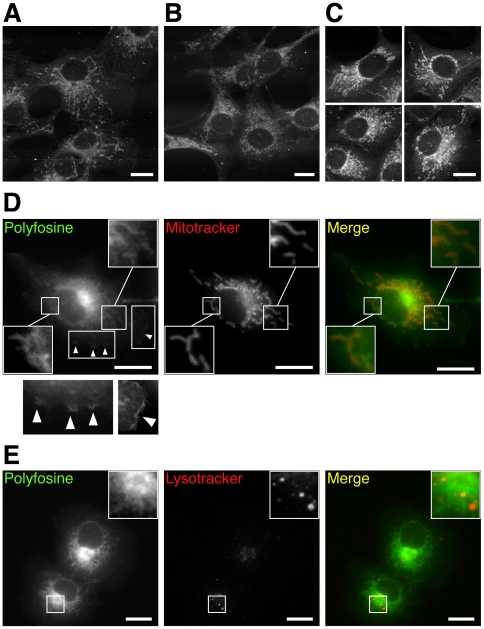
Figure 7. Imaging of polyfosine in COS7 cells.
Cells incubated with 50 µM of polyfosine for 1 h (A, D & E), 2.5 h (B), or 5 h (C) were imaged by two-photon-excited lipid fluorescence (A–C) or epifluorescence (D & E) microscopy. Merged color images show polyfosine in green (D & E) and mitochondria (D) or lysosomes (E) stained by Mitotracker or Lysotracker, respectively, in red. Polyfosine stained convoluted PM ruffles (D, arrow heads). Bars, 20 µm.

