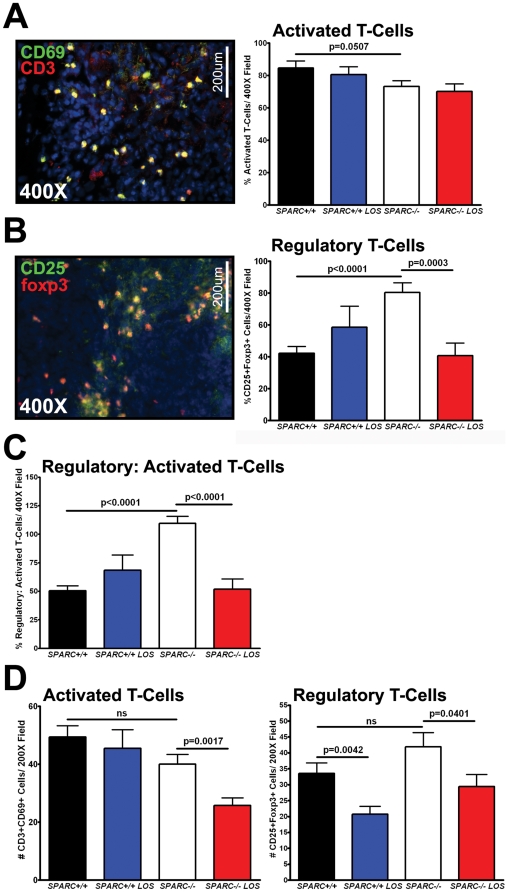
Figure 7. Losartan reduces Treg levels in Pan02 tumors grown in SPARC−/− mice.
Fluorescence immunohistochemistry was utilized to assess the recruitment of activated and regulatory T-cells in Pan02 orthotopic tumors (A–C) or spleens (D) in SPARC+/+ and SPARC−/− mice treated with losartan. (A) Frozen tumor sections were stained with antibody rat anti-CD3 (red) and hamster anti-CD69 (green) for detection of activated T-cells. DAPI (blue) marks cell nuclei. Percent activated T-cells was calculated by dividing the number of CD3 and CD69 double positive cells by the total number of CD3 positive cells. Total magnification (400×) and scale bars (200 µm) are indicated. (B) Frozen tumor sections were stained with rat anti-foxp3 (red) and rat anti-CD25 (green) for detection of regulatory T-cells. DAPI (blue) marks cell nuclei. Percent regulatory T-cells was calculated by dividing the number of foxp3 and CD25 double positive cells by the total number of CD3 positive cells. Total magnification (400×) and scale bars (200 µm) are indicated. (C) The ratio of regulatory T-cells to activated T-cells was calculated by dividing the number of CD3 and CD69 double positive cells by the number of foxp3 and CD25 double positive cells. Data was recorded as percent. (D) Frozen splenic sections were stained for activated and regulatory T-cells as described in A and B. The number of activated and regulatory T-cells was counted. ns, not significant. All p-values were calculated with the Student's t test.

