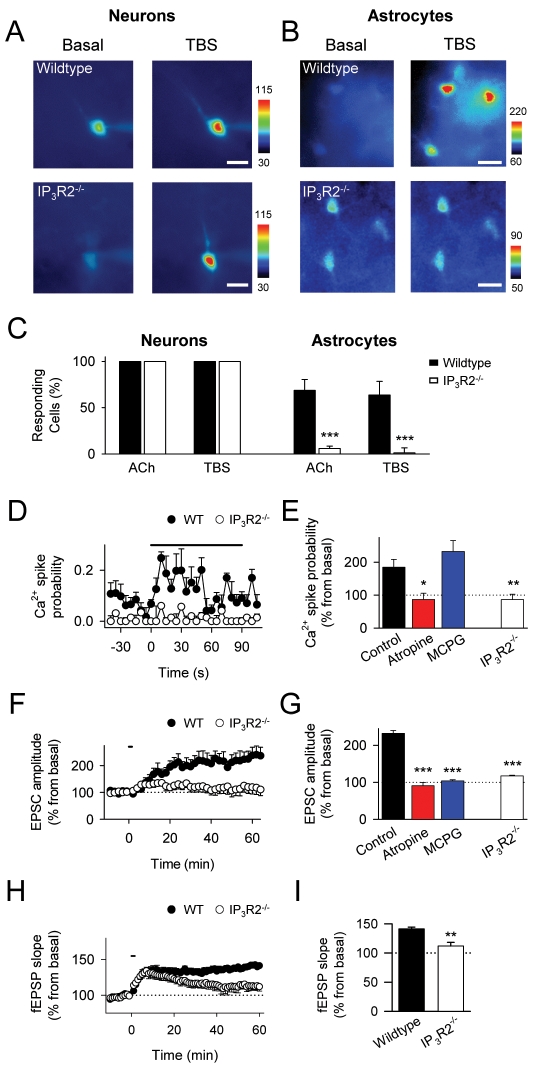
Figure 4. Cholinergic-induced hippocampal LTP is altered in IP3R2−/− mice.
(A) Pseudocolor images representing fluorescence intensities of pyramidal neurons filled with fuo-4 through the recording pipette before (basal) and during alveus TBS in wildtype (top) and IP3R2−/− mice (bottom). Scale bar, 20 µm. (B) Pseudocolor images representing fluorescence intensities of fluo-4-filled astrocytes before (basal) and during alveus TBS in wildtype (top) and IP3R2−/− mice (bottom). Scale bar, 15 µm. (C) Proportion of responding neurons and astrocytes to ACh application and alveus TBS in wildtype and IP3R2−/− mice (6 and 10 neurons from n = 6 and 10 slices for each stimulus in wildtype and IP3R2−/− mice, respectively; for ACh: 111 and 157 astrocytes from n = 6 and 15 slices; for TBS: 81 and 64 astrocytes from n = 9 and 10 slices, in wildtype and IP3R2−/− mice, respectively). (D) Astrocyte Ca2+ spike probability in wildtype and IP3R2−/− mice (81 and 64 astrocytes from n = 9 and 10 slices, respectively). (E) Average relative changes of maximum astrocyte Ca2+ spike probability (from basal values) during alveus stimulation in control (81 astrocytes from n = 9 slices), atropine (25 astrocytes from n = 4 slices), and MCPG (40 astrocytes from n = 5 slices) in wildtype mice and control IP3R2−/− mice (64 astrocytes from n = 10 slices). (F) Relative EPSC amplitudes versus time in slices from wildtype (n = 8) and IP3R2−/− (n = 8) mice. (G) Average relative changes of EPSC amplitudes evoked 60 min after alveus TBS in slices from wildtype mice in control (n = 8), atropine (n = 4), and MCPG (n = 5), and from IP3R2−/− mice (n = 8). (H) Relative mean fEPSP slope versus time in in vivo wildtype (n = 6) and IP3R2−/− mice (n = 4) before and after sensory stimulation. (I) Average relative changes of the mean fEPSP slope evoked 60 min after sensory stimulation in wildtype (n = 6) and IP3R2−/− mice (n = 6). In (D), (F), and (H), zero time corresponds to the onset of stimulation (horizontal bars). *p<0.05, **p<0.01, ***p<0.001.

