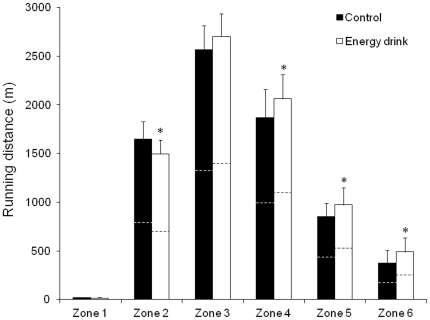
Figure 4. Running distance covered at different speeds during a simulated soccer game.
Running distance covered at different speeds during a simulated soccer game with the ingestion of a caffeinated energy drink (3 mg of caffeine/kg of body weight) or the ingestion of a decaffeinated control drink. Data are mean ± SD for 19 soccer players. * Different from control (P<0.05). Dashed lines indicate the half time. Zone 1 (Standing) = 0–0.4 Km · H−1; Zone 2 (Walking) = 0.5–3.0 Km · H−1; Zone 3 (Low-Intensity Running) = 3.1–8.0 Km · H−1; Zone 4 (Medium-Intensity Running) = 8.1–13.0 Km · H−1; Zone 5 (High-Intensity Running) = 13.1–18.0 Km · H−1; Zone 6 (Sprinting) = Speed Higher Than 18.0 Km · H−1.

