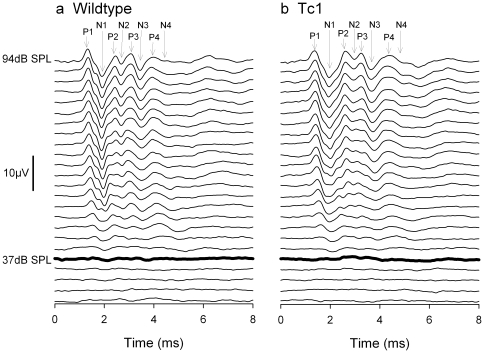
Figure 1. Click-evoked ABR waveforms in control and Tc1 mice.
Averaged ABR waveforms recorded in response to clicks in a wildtype (a) and Tc1 (b) mouse. Waveforms are displayed for stimuli in 3 dB incremental steps from 25 dB SPL at the bottom to 94 dB SPL at the top of each panel. Positive peaks 1–4 (P1–P4) and negative peaks (N1–N4) are indicated by arrows at the top of each panel. The heavy black line indicates the visually-determined threshold; 37 dB SPL in both cases. The scale-bar indicates 10 µV amplitude.

