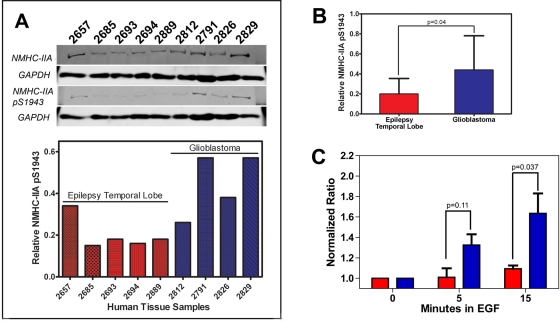
FIGURE 7:
Myosin IIA heavy chain phosphorylation in GBM. (A) Immunoblot analysis of myosin IIA Ser-1943 phosphorylation in human tissue lysates derived from human epilepsy temporal lobe (red) or GBM (blue). GAPDH was used as a loading control. Relative phosphorylation levels were determined by dividing the myosin IIA pSer-1943/GAPDH ratio by the total myosin IIA/GAPDH ratio. (B) The normalized level of pSer-1943 myosin IIA is significantly increased in GBM samples (0.44 ± 0.15) vs. epileptic temporal lobes (0.20 ± 0.08). Values represent the mean ± SD. (C) EGF-mediated increases in myosin IIA pSer-1943 in C6 (red) and C6-EGFR (blue) glioma cells as a function of time after EGF exposure. Cells were serum-starved and stimulated with 16.5 ng/ml EGF, and the phosphorylation status of the myosin IIA heavy chain was examined by immunoblot with an antibody that recognizes pSer-1943. Phosphorylation is expressed as the change relative to unstimulated cells. Values represent mean ± SD for three (C6) and two (C6-EGFR) independent experiments.

