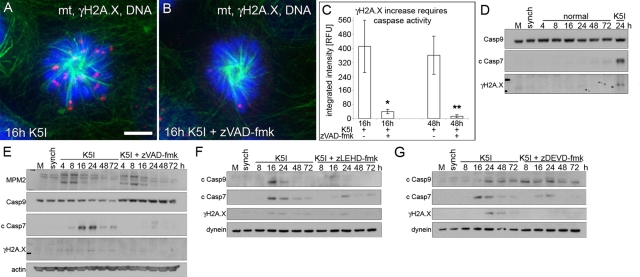
FIGURE 4:
DNA damage during mitotic arrest is dependent upon caspase-9 and -7. (A and B) Green, microtubules (mt); red, γH2A.X; blue, DNA. G2-synchronized cells released for 16 h into K5I or K5I with the caspase inhibitor zVAD-fmk show γH2A.X increase is caspase-dependent. Scale bar: 5 μm. (C) γH2A.X quantification of single cells shows caspase-dependent DNA damage in 16 h mitosis-arrested cells and 48 h postslippage cells. Average integrated fluorescence intensity (± SE). RFU, relative fluorescence units. n = 50+ for each condition; two experiments . *, p < 0.05 vs. 16 h K5I; **, p < 0.05 vs. 48 h K5I. (D) Mock, untreated (M) and G2-synchronized (synch) cells, and synchronized cells released into normal medium show no activation of caspase-9 or -7, as measured by loss of full-length caspase-9 (Casp9) or increase in cleaved caspase-7 (c Casp7). γH2A.X also did not increase compared with 24 h K5I. (E) Release into K5I shows loss of caspase-9, increased cleaved caspase-7, and increased γH2A.X in late arrest/early slippage (MPM2 blot) blocked by zVAD-fmk. MPM2 indicates several bands during mitosis. (F) Caspase-9 inhibition with zLEHD-fmk prevented caspase-9 and -7 activation (c Casp9 and c Casp7) and inhibited γH2A.X increase. (G) Caspase-7 inhibition with zDEVD-fmk did not prevent caspase-9 activation, but largely blocked caspase-7, resulting in decreased γH2A.X. Note: the slightly higher-migrating cleaved caspase-7 band in the presence of caspase inhibitors in (E, F, and G) represents incomplete processing (activation). All blots in each panel are from the same gels and/or samples. Dynein and actin are the loading controls.

