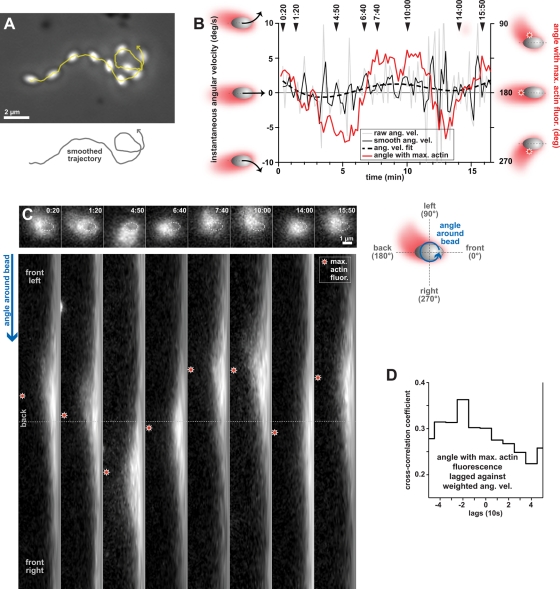
FIGURE 7:
The actin comet tail alternates position from side to side as an ellipsoidal bead changes direction in its trajectory. (A) Phase-contrast images from multiple frames of a time-lapse sequence are composited to show the location of an uncoated bead that changes direction along its trajectory. The raw trajectory is shown in yellow and the arrowhead indicates that the bead moved from left to right. A smoothed version of the track is shown below the image to clarify the direction of the final loop. Scale bar: 2 μm. (B) The instantaneous angular velocity (left y-axis) and angular position of the maximum actin fluorescence on the bead surface (right y-axis) correlate with each other as the bead changes direction. The raw instantaneous angular velocity of the bead (gray line) was smoothed using a weighted average (black solid line) and fit using a polynomial function (dashed black line). The left y-axis of the graph was truncated at −10°/s and 10°/s so that five values greater than 10°/s in magnitude are not shown. The angular position of the maximum actin fluorescence on the bead surface (right y-axis, red line) is used to follow the location of the comet tail. The time points indicated at the top of the graph correspond to the images in (C). (C) The actin comet tail slides about the back of the bead from one side to the other as the bead changes direction. Time-lapse images in the bead frame of reference (top) generated the polar-transformation images (bottom). The location of the bead is depicted by the outline (top, dashed white ellipses). The angle around the bead is represented vertically in the transformed images. Stars indicate the location of the maximum actin fluorescence measured on the bead surface. Images shown correspond to time points indicated in the graph in (B). The schematic on the right illustrates the polar transformation. Scale bar: 1 μm. Time: min:s. See also Video S11. (D) The time-lagged cross-correlation of the angular position of the maximum actin fluorescence on the bead and the weighted angular velocity shows a peak at a time lag of −2 (or −20 s). Changes in the direction of bead trajectory turning (angular velocity) preceded the repositioning of the comet tail on the bead's surface by ∼20 s.

