FIGURE 3:
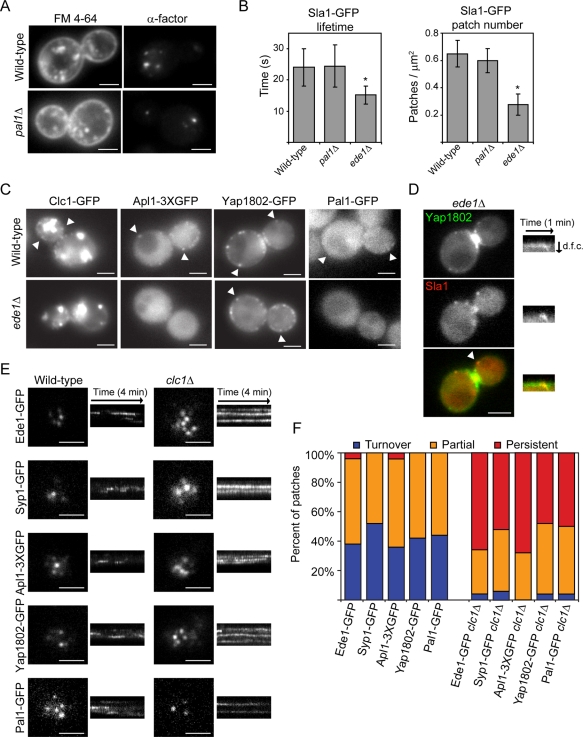
Analysis of the roles of Pal1p, Ede1p, and Clc1p in endocytosis. (A) FM 4-64 uptake (left) and fluorescent α-factor uptake (right) in the indicated strains after 10 min. (B) Lifetimes of Sla1-GFP patches ± SD (n = 50 patches; left) and Sla1-GFP patch number per cell surface area (μm2) ± SD (n = 20 cells; right) for the indicated yeast. Patch number was counted from maximum-intensity Z-projections of unbudded or large-budded cells. Movies used to generate lifetime data were acquired at a rate of one frame per second. Asterisk indicates a statistically significant decrease compared with wild-type (p < 0.0001). (C) Images of wild-type and ede1Δ yeast expressing Clc1-GFP, Apl1-3XGFP, Yap1802-GFP, or Pal1-GFP. White arrowheads indicate examples of cortical patches. (D) Images of an ede1Δ yeast cell expressing Yap1802-GFP and Sla1-mCherry. Kymographs of the patch indicated by the white arrowhead are from two-color movies. d.f.c., distance from cortex. (E) TIRF microscopy images of wild-type and clc1Δ yeast cell expressing Ede1-GFP, Syp1-GFP, Apl1-3XGFP, Yap1802-GFP, or Pal1-GFP. Kymographs are taken from 4-min movies. (F) Percentage of patches in the indicated strains that assemble and disassemble within a 4-min interval (turnover), are present throughout the TIRF microscopy movie (persistent), or are present in either the first or last frames of the movie (partial; n = 50 patches). All white scale bars, 2 μm.

