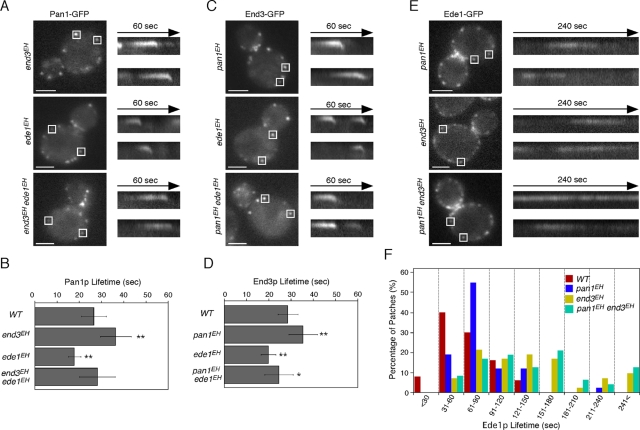
FIGURE 4:
Localization of EH domain proteins in EH domain mutants. (A, C, E) Localization of Pan1-GFP (A), End3-GFP (C), and Ede1-GFP (E) in cells expressing mutant forms of other EH domain proteins. Right, kymographs from the same movies. (B, D) Average lifetimes of Pan1-GFP and End3-GFP ± SD in mutant cells. Data were taken from 2-min movies with a 1-s frame interval. n = 50 patches for each strain. *p < 0.01, **p < 0.001. Scale bars, 2 μm. (F) Distribution of Ede1-GFP patch lifetimes in wild-type and indicated mutant cells. n = 50 patches for each strain. Movies were taken with a 1-s frame interval.

