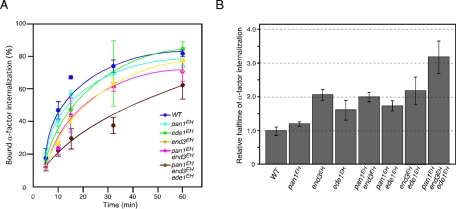
FIGURE 5:
Effects of EH mutations on endocytic internalization. (A) Radiolabeled α-factor internalization assays performed on cells expressing the indicated strains at 25°C. Each curve represents the average of three independent experiments, and error bars indicate the SD at each time point. (B) A histogram representing the relative half-time of the α-factor internalization rate calculated from an exponential curve fit on the assay shown in A. Error bars indicate the SD from at least three experiments.

