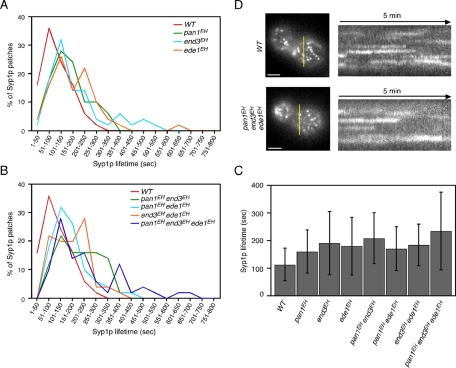
FIGURE 6:
Dynamics of Syp1p patch in EH domain mutants. (A, B) Distribution of Syp1p patch lifetimes in the indicated single (A) or double and triple EH domain mutants (B). Data were taken from ∼13-min movies with a 4-s frame interval. (C) Average lifetimes of Syp1-GFP ± SD for indicated strains. (D) Left, localization of Syp1-3GFP from the indicated strains. Yellow bars mark where the kymograph was generated. Right, kymograph representations of Syp1-3GFP from 5-min movies. Scale bars, 2 μm.

