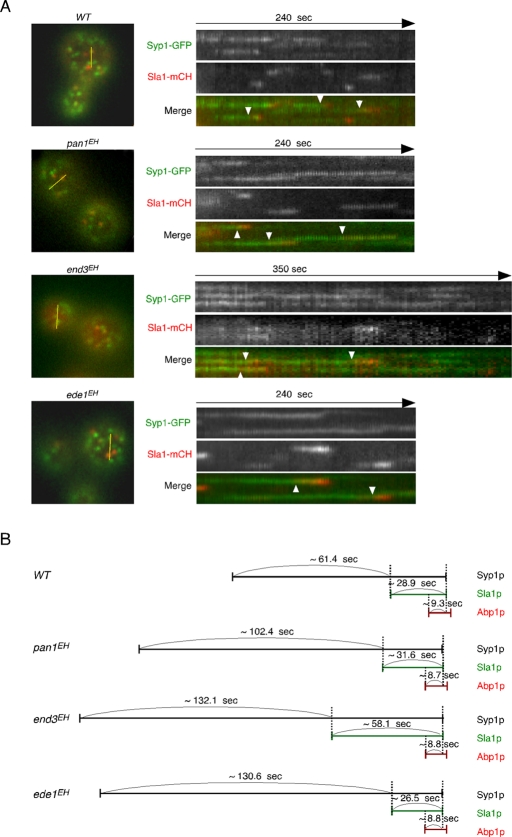
FIGURE 7:
Localization and temporal relationship of Syp1p and Sla1p patches in EH domain mutants. (A) Left, localization of Syp1-GFP and Sla1-mCherry (mCH) in live cells. Yellow bars mark where the kymograph was generated. Right, kymograph representations of Syp1-3GFP and Sla1-mCherry from 4- or 6-min movies. Arrowheads indicate examples of Syp1p patches that are joined by Sla1-mCherry. All movies were taken with a 3-s frame interval for both Syp1-GFP and Sla1-mCherry. Scale bars, 2 μm. (B) Temporal relationship of Syp1p, Sla1p, and Abp1p patches in EH domain mutants. Average time was obtained from at least 30 independent patches.

