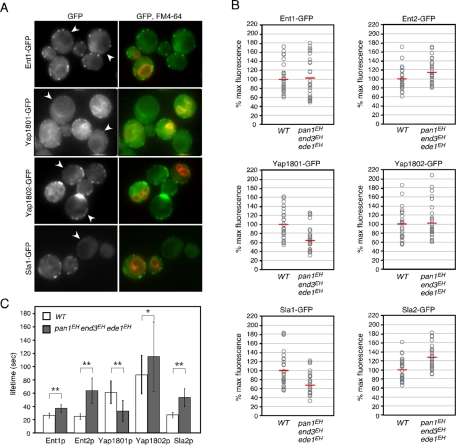
FIGURE 9:
Effects of EH domain mutations on endocytic proteins. (A) Localization of GFP-tagged endocytic proteins in wild-type and triple-mutant cells. Two strains were mixed and acquired in the same images. Only wild-type cells were labeled with FM4-64 in the right-hand images. Arrowheads indicate triple mutant cells. (B) The relative maximum fluorescence intensities of indicated GFP-fused proteins at cortical patches. Intensities of individual patches were compared in the same image by mixing wild-type and triple-mutant cells, which were distinguishable from FM4-64-treated wild-type cells. The values of intensities for wild-type and triple-mutant cells were divided by the mean for patch intensities in wild-type cells (n = 30), and the resulting values were multiplied by 100. Each open circle and horizontal red line represents intensity of a single patch and the mean of the intensities, respectively. (C) Patch lifetimes ± SD of GFP-tagged endocytic proteins in wild-type and triple mutant cells. Data were obtained from ∼3-min movies taken with a 1-s frame interval. n = 50 patches for each strain. *p < 0.01, **p < 0.001.

