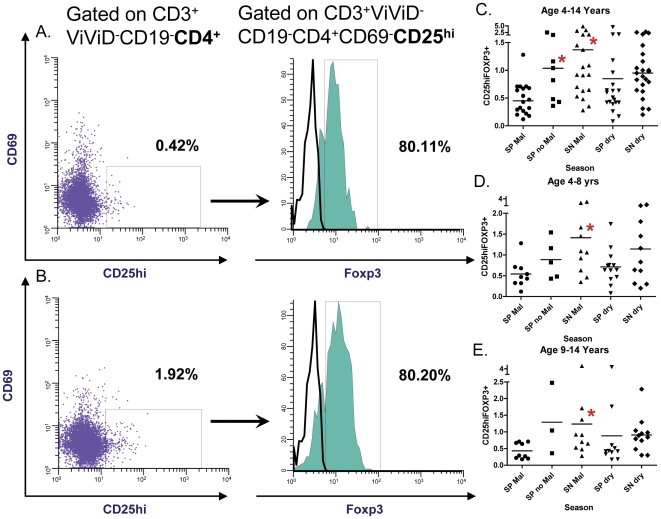
Figure 1. T regulatory cell detection.
Quantification of T regulatory cells gated on CD3+ViViD−CD19−CD4+ with representative plots depicting the percentage of CD25hi and FOXP3+ expression (closed histogram) in (a) a child with S. haematobium and concomitant P. falciparum malaria (SP Mal) and (b) a child with P. falciparum malaria (SN Mal) alone. The percentages of gated populations are denoted in each filled histogram (a, b). Region placement was aided by fluorescence minus one (FMO) determinations for CD69+ and FOXP3+ cells (open histogram). Dot plots of percentage of CD3+ViViD−CD19−CD4+CD69−CD25hiFOXP3+ expression and segregated by group and season are depicted in children (c) aged 4–14 years, (d) aged 4–8 years and (e) aged 9–14 years. Each dot represents one individual. Bars represent the median and asterisks depict statistically significant differences between the indicated subset of volunteers and SP children during the transmission season (paired student T test with level of significance set at P<0.05).

