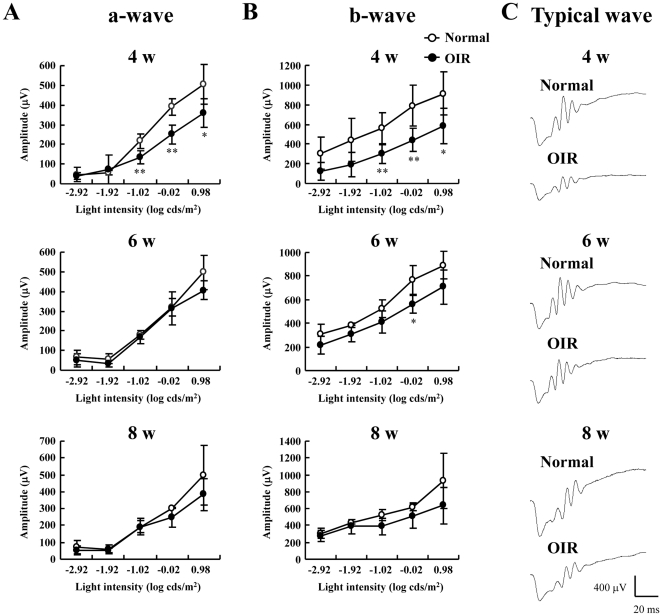
Figure 1. Measurement of dark-adapted electroretinography (ERG) amplitudes in the oxygen-induced retinopathy (OIR) model and normal mice.
Amplitudes of a- (A) and b-waves (B) from the OIR model or from normal mice were measured at 4, 6, and 8 w. Stimulus flashes were used from −2.92 to 0.98 log cds/m2. (C) Representative ERG waveforms at 4, 6, and 8 w. Values are expressed as the mean ± S.D., n = 4 to 6. * P<0.05, ** P<0.01 versus Normal. OIR, oxygen-induced retinopathy model.

