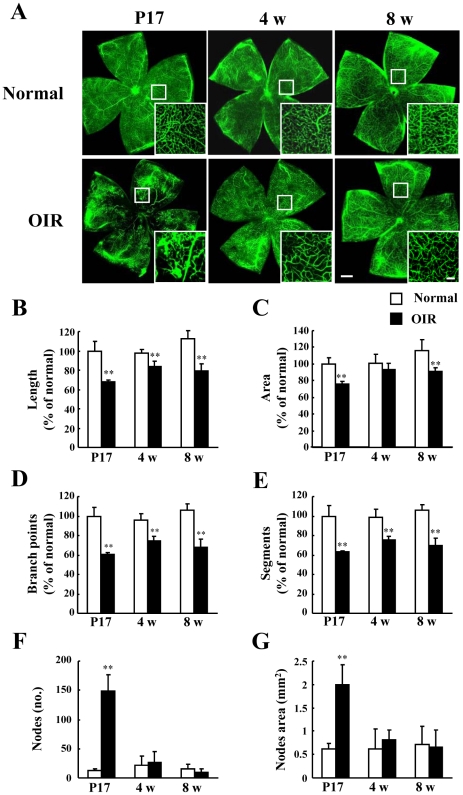
Figure 4. The development of retinal vascular lumen in the oxygen-induced retinopathy (OIR) model and normal mice.
(A) Flat-mounted retinas in the OIR model mice and normal mice, along with (insets) enlargements, at 3 time points (P17, 4 w, and 8 w). Scale bars, 500 µm (100 µm in insets). Quantitative analysis of retinal vascular lumen at 4 w and 8 w was performed using an imaging analyzer (the Angiogenesis Tube Formation module) on the entire retina; 4 parameters were measured: (B) length, (C) area, (D) branch points, and (E) segments. Values are expressed as the mean ± S.D., n = 4 or 5. ** P<0.01 versus normal. OIR, oxygen-induced retinopathy model.

