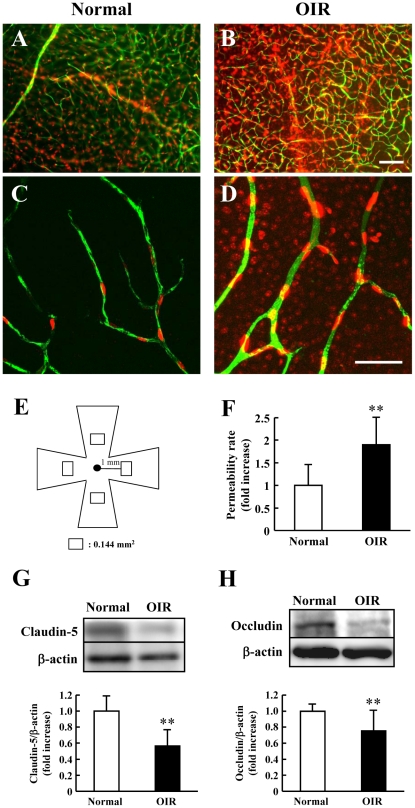
Figure 5. Retinal permeability in the oxygen-induced retinopathy (OIR) model and normal mice.
Each upper image is shown using Metamorph (A, B). Confocal fluorescence micrographs (C, D) show a higher magnification version of part of the corresponding upper image. Scale bars, 100 µm (B) and 50 µm (D). Retinal permeability was evaluated in the 4 areas shown in (E) (each area 0.144 mm2×4 areas; total area 0.576 mm2) at 8 w. (F) Retinal permeability rate was quantified using mathematical formulae; see Materials and Methods for further details. Western immunoblots of claudin-5 (G), occludin (H), and β-actin proteins in the retina at 8 w in the OIR model mice and in normal mice. Expression was quantified by densitometry and corrected by reference to β-actin. Values are expressed as the mean ± S.D., n = 7 or 8. ** P<0.01 versus normal.

