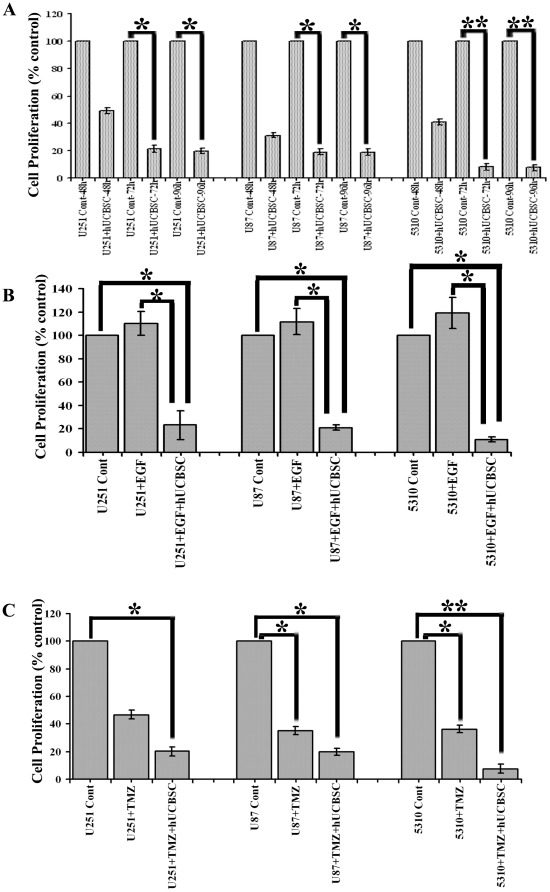
Figure 5. Inhibition of cell proliferation by hUCBSC treatments.
(A) Control and hUCBSC-treated glioma cells at different time points were analyzed for cell proliferation by incorporation of BrdU. *Significant at p<0.05 compared to respective control cells. **Significant at p<0.01 compared to respective control cells (by t-test). (B) Control, EGF-treated and EGF+hUCBSC treated glioma cells were analyzed for cell proliferation. *Significant at p<0.05 both for control vs. EGF+hUCBSC treatment and EGF vs. EGF+hUCBSC treatments (one-way ANOVA followed by Bonferroni's post hoc test). (C) Control, TMZ treated, TMZ+hUCBSC treated glioma cells were subjected to cell proliferation analysis by BrdU incorporation. *Significant at p<0.05; **Significant at p<0.01 both for control vs. TMZ treatment and control vs. TMZ+hUCBSC treatments (one-way ANOVA followed by Bonferroni's post hoc test). For all these tests, raw data was taken into consideration to perform statistical analyses and then results were presented as % control values. Each bar represents n≥6.

