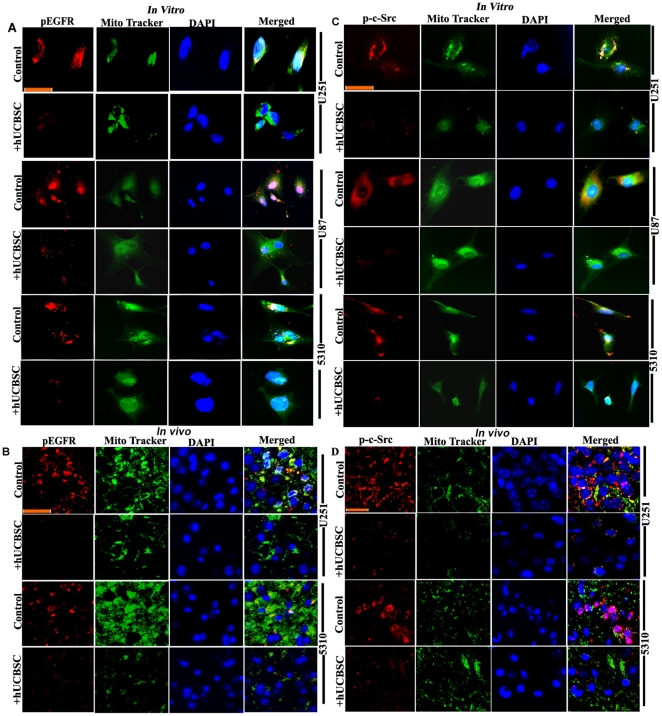
Figure 6. Downregulation of pEGFR and phospho-c-Src in mitochondria in hUCBSC treatments.
(A) Control and hUCBSC-treated U251, U87 and 5310 cells were labeled with pEGFR and Mito Tracker green and processed for immunofluorescence. (B) Control and hUCBSC-treated U251 and 5310 tissue sections were labeled with pEGFR and Mito Tracker green and processed for immunofluorescence. pEGFR was conjugated with Alexa Fluor 594 (red) secondary antibody (n≥3; bar = 100 µm). (C) Control and hUCBSC-treated U251, U87 and 5310 cells were labeled with phospho-c-Src and Mito Tracker green and processed for immunofluorescence. (D) Control and hUCBSC-treated U251 and 5310 tissue sections were labeled with phospho-c-Src and Mito Tracker green and processed for immunofluorescence. Phospho-c-Src was conjugated with Alexa Fluor 594 (red) secondary antibody (n≥3; bar = 100 µm).

