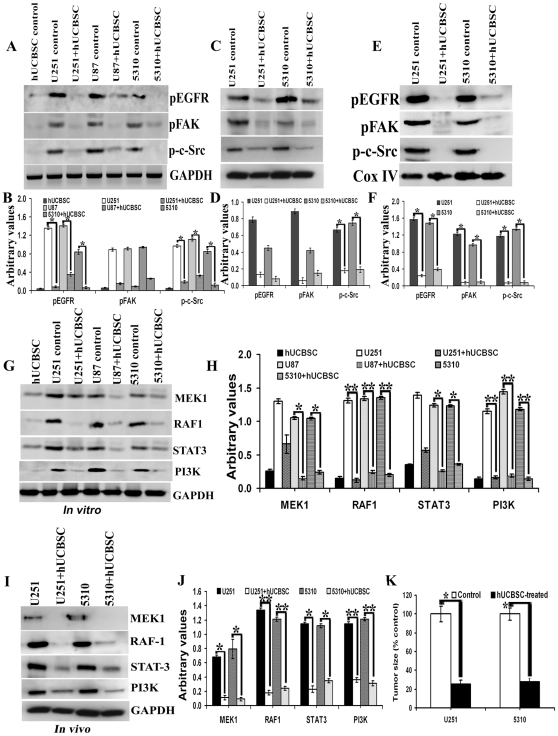
Figure 7. Downregulation of EGFR-mediated signaling molecules in hUCBSC treatments.
For (A), (C), (E), (G) and (I) 40 µg of proteins were loaded onto 8–12% gels and transferred onto nitrocellulose membranes, probed with respective antibodies, and developed by autoradiography. (A) In vitro samples probed with pEGFR, pFAK, p-c-Src and GAPDH. (B) Quantitative analysis of (A). *Significant at p<0.05 compared to respective control glioma cells. (C) In vivo cytosolic fractions probed with pEGFR, pFAK, p-c-Src and GAPDH. n = 3. (D) Quantitative analysis of (C). *Significant at p<0.05 compared to respective control glioma tissues. (E) In vivo mitochondrial fractions probed with pEGFR, pFAK, p-c-Src and Cox IV. n = 3. (F) Quantitative analysis of (E). *Significant at p<0.05 compared to respective control glioma tissues. Control and hUCBSC-treated U251, U87 and 5310 glioma cell lysates (G) and control and hUCBSC-treated U251 and 5310 glioma tissue lysates (I) were processed for immunoblotting and probed with MEK1, RAF1, Stat3 and PI3K antibodies. GAPDH served as a loading control. (H) Quantitative estimation of (G). *Significant at p<0.05 compared to respective glioma control cells. **Significant at p<0.01 compared to respective glioma control cells. (J) Quantitative estimation of (I). *Significant at p<0.05 compared to respective glioma control tissues. **Significant at p<0.01 compared to respective glioma control tissues. (K) Tumor size volume estimated in control and hUCBSC treated nude mice brains. *Significant at p<0.05 compared to glioma controls. Error bars indicate ± SD. For (A) to (K), n≥3.

