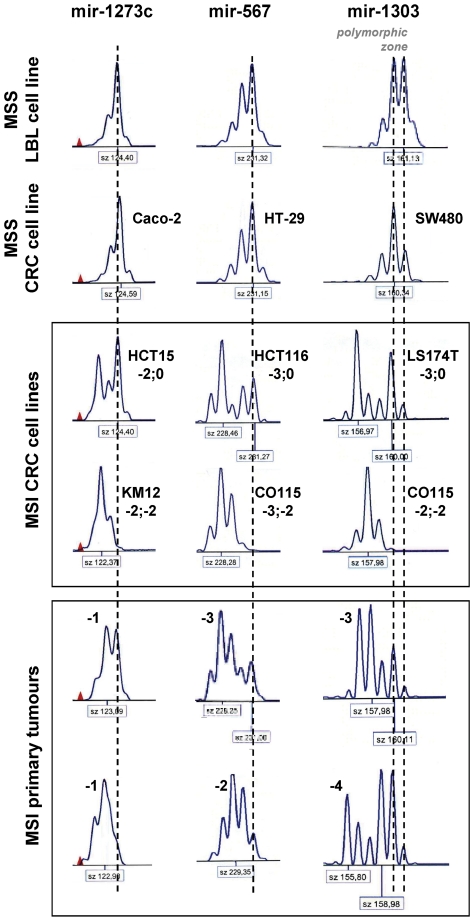
Figure 4. MNR instabilities in hsa-mir-1273c (T11), hsa-mir-567 (A13) and hsa-mir-1303 (T13).
Allelic profiles for several MSI CRC cell lines and primary tumors are shown. Normal profiles are defined in LBL and MSS cell lines and primary tumors. For monomorphic genes, a dashed vertical line indicates the unique allele. The polymorphic zone for hsa-mir-1303 is defined between two dashed vertical lines going along the 2 alleles (see Figure S1). Sizes (bp) are indicated in a box below each profile. Various allelic deletions ranging from 1 to 4 bp were observed in MSI CRC cell lines and primary tumors and are indicated in bold. The observed deletions were sometimes bi-allelic in MSI CRC cell lines. In MSI primary tumors, the allelic profiles were also highly suggestive of bi-allelic mutations. Due to the inherent polymorphism that can modify the length of the sequence, the hairpin sequence of hsa-mir-1303 was determined for a correct and reliable evaluation of the alterations in MSI CRC cell lines (see Table S2).

