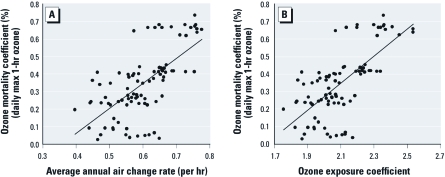
Figure 3.
For all 90 NMMAPS cities included in the extended analysis, ozone mortality coefficients versus (A) average annual air change rates (1.42x – 0.50, R2 = 0.43), and (B) ozone exposure coefficients (y = 0.78x – 1.28, R2 = 0.47). Ozone mortality coefficients are based on daily maximum (max) 1-hr ozone.

