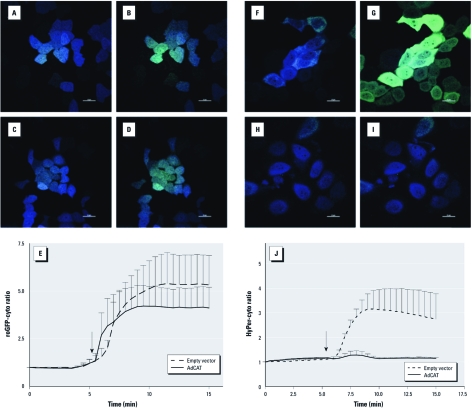
Figure 2.
Catalase overexpression blunted 1,2‑NQ–induced hydrogen peroxide signals but not redox changes. Stably transduced BEAS-2B cells expressing roGFP-cyto (A–D) or HyPer-cyto (F–I) that received either an empty vector (A, B, F, G) or an adenoviral vector encoding catalase (AdCAT; C, D, H, I) were exposed to DMSO (B,G) or 100 µM 1,2‑NQ (D,I). In A–D and F–I, bars = 20 µm. (E,J) Time courses of roGFP-cyto ratios (E) or HyPer-cyto (J) were plotted for cells receiving empty vector or AdCAT. Arrows indicate the the time DMSO or 100 µM 1,2‑NQ was added; values shown are mean ± SE (n = 3).

