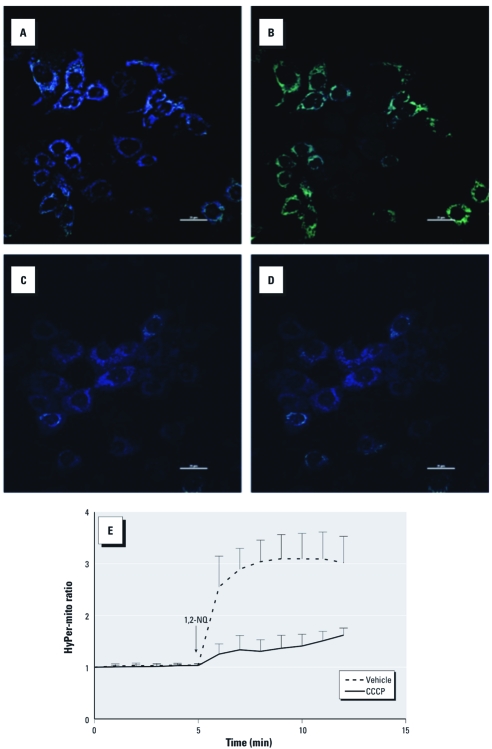
Figure 5.
Confocal imaging of 1,2‑NQ–induced H2O2 production in mitochondria of BEAS-2B cells expressing HyPer-mito. Mitochondrial H2O2 was monitored as the ratio of HyPer-mito fluorescence emission intensity under 488/404 nm excitation in cells preincubated with DMSO vehicle (A,B) or 10 µM CCCP (C,D) before (A,C) and after (B, D) exposure to 100 µM 1,2‑NQ. In A–D, bars = 20 µm. (E) Plot of H2O2 production in BEAS-2B cells expressing HyPer-mito and pretreated with vehicle or 10 µM CCCP before the addition of 100 µM 1,2‑NQ (mean ± SE; n = 3).

