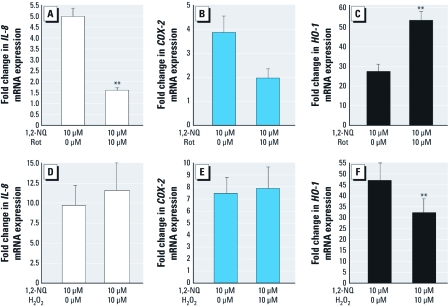
Figure 6.
Differential role of mitochondrial H2O2 in 1,2‑NQ–induced gene expression in BEAS-2B cells pretreated with DMSO vehicle, the mitochondrial complex I inhibitor rotenone (Rot; 10 µM, 30 min), or H2O2 (30 µM, 10 sec) prior to the addition of 10 µM 1,2‑NQ for 4 hr. mRNA levels of IL-8 (A,D), COX‑2(B,E), and HO-1 (C,F) were measured using TaqMan-based RT-PCR, normalized to levels of β-actin mRNA, and expressed as fold increases over vehicle control (mean ± SE; n = 3). **p < 0.01.

