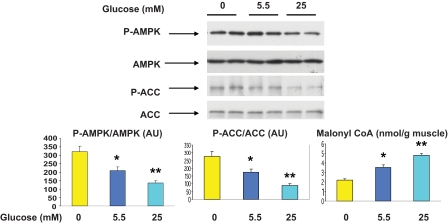
FIG. 4.
Effect of incubation with different concentrations of glucose on AMPK and ACC phosphorylation, AMPK abundance, and malonyl CoA content. EDL muscles were incubated for 1 h in media containing 0, 5.5, or 25 mmol/l glucose. Representative Western blots (upper panel). Densitometric analysis of blots and malonyl CoA content (lower panel). Results are means ± SE (n = 4). *P < 0.05 vs. 0 mmol/l glucose and **P < 0.01 vs. 0 and 5.5 mmol/l glucose. (A high-quality color representation of this figure is available in the online issue.)

