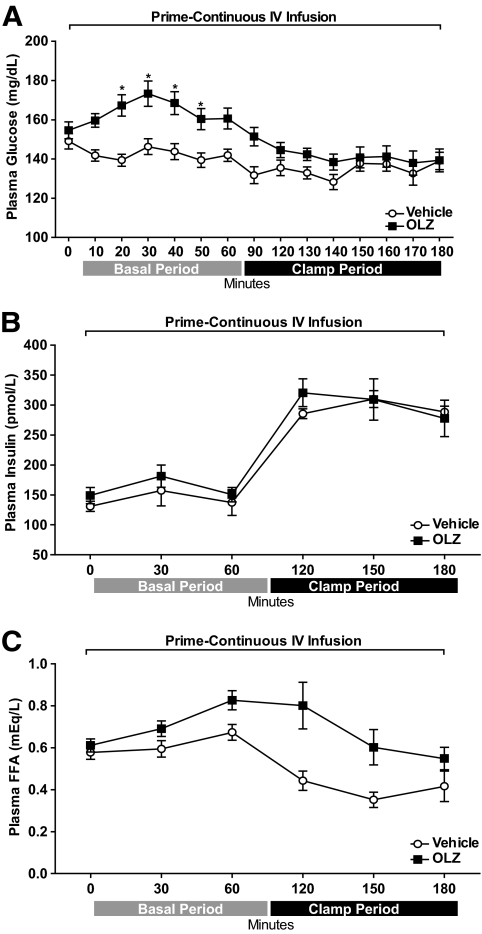
FIG. 1.
Time course (means ± SE) of plasma levels of glucose (A), insulin (B), and FFAs (C) during basal and hyperinsulinemic-euglycemic clamp periods. Minute 0 represents sampling before a prime-continuous (a bolus of 1.5 mg/kg and 1.0 mg/kg/h) intravenous (IV) infusion of OLZ (OLZ-IV, n = 10) or vehicle (n = 8) *Statistics denote comparison to respective 0 min and vehicle time point. Two-way ANOVA followed by Duncan test, P < 0.05.

