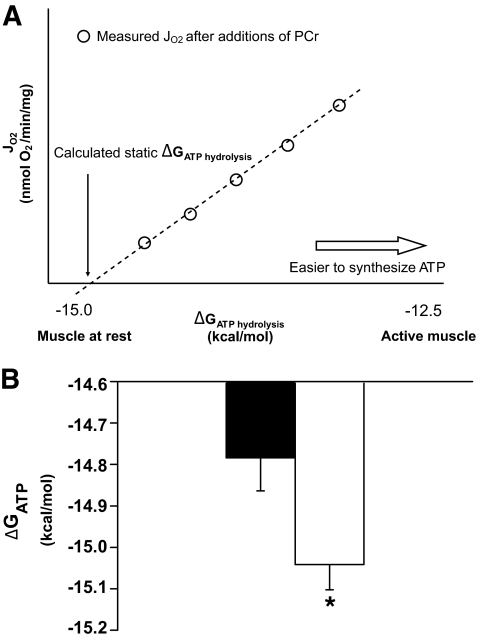
FIG. 3.
Static head ΔGATP. Isolated mitochondria were challenged with pyruvate plus malate at different PCr-to-Cr ratios. A: schematic representation of the Jo2 vs. ΔGATP plot. B: The static head ΔGATP was calculated by extrapolating the curve of the Jo2 vs. ΔGATP curve to Jo2 = 0. (□, lean insulin-sensitive participants; ■, obese insulin-resistant participants.) Data are presented as means ± SEM; n = 7 per group. Student's t test was performed. *P < 0.01 vs. lean participants.

