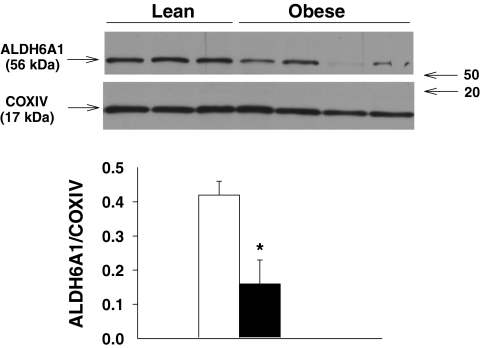
FIG. 4.
Comparison of protein abundances determined by mass spectrometry to immunoblotting. Mitochondrial lysates (20 μg) (n = 3–4) were probed for ALDH6A1 and COXIV abundances. ALDH6A1 abundance was normalized to a loading control (COXIV). (□, lean insulin-sensitive participants; ■, obese insulin-resistant participants.) *P = 0.06.

