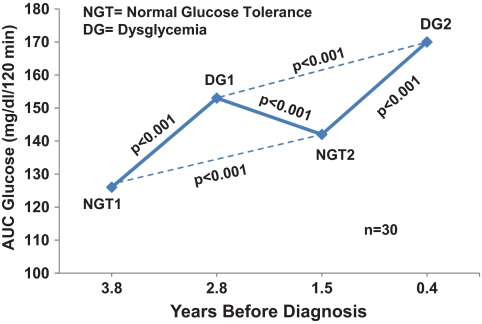
FIG. 1.
Shown is a sequence of alternating NLOGTTs and DYSOGTTs in progressors to type 1 diabetes. Each point represents the mean AUC glucose from the OGTTs. The mean time before diagnosis is shown for each of the OGTTs. There were significant increases in the AUC glucose from each of the NLOGTTs to their subsequent respective DYSOGTTs. There were also significant increases from the first NLOGTTs to the second NLOGTTs and from the first DYSOGTTs to the second DYSOGTTs.

