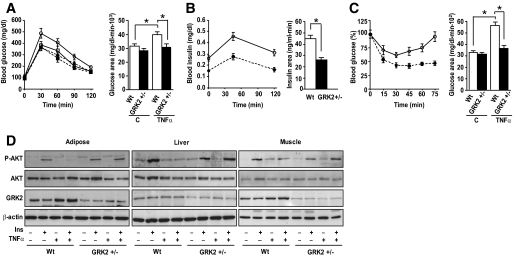
FIG. 4.
GRK2+/− mice do not develop TNF-α–induced insulin resistance. Wt (open symbols, solid lines) and GRK2+/− (filled symbols, dotted lines) adult male mice were treated with TNF-α (0.1 μg/g body wt, circles) or vehicle (100 μl PBS plus 0.1% BSA, squares) for 48 h. A: GTTs were performed on animals that had been fasted for 24 h and were given an injection of glucose (2 g/kg body wt). B: Circulating insulin levels during the GTTs. C: ITTs were performed on fed male mice that had received insulin (0.8 IU/kg body wt). Glucose concentration was determined in blood samples obtained from the tail vein. Results are means ± SEM of eight animals for each group. Histograms on the right show the incremental area under the curve. *P < 0.01. D: Wt and GRK2+/− male mice were treated or not with insulin (1 IU/kg body wt) for 15 min, and eWAT, liver, and muscle were removed. Lysates were subjected to Western blot with the indicated antibodies against total and phosphorylated AKT (Ser473), GRK2, and β-actin. Representative immunoblots of four independent experiments are shown. See supplementary Fig. S2 and supplementary Table 1 for detailed quantification of these data. For examples of full-length blots, see supplementary Fig. S4, available in an online appendix.

