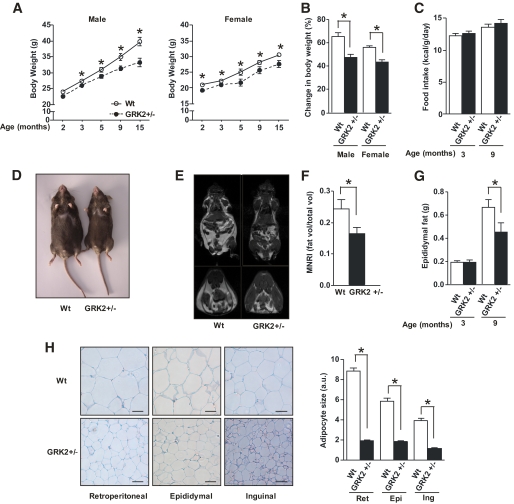
FIG. 7.
GRK2+/− mice exhibit reduced adiposity. A: Body weight evolution in male or female Wt (open circles, solid lines) and GRK2+/− (filled circles, dotted lines) mice between 2 and 15 months of age. B: Percentage of change in body weight during 13 months. C: Daily food intake in 3- and 9-month-old male Wt and GRK2+/− mice. D: Representative photograph showing 9-month-old Wt or GRK2+/− male mice. E: Adiposity in 9-month-old male mice measured by MNRI; white represents areas with >50% fat. F: Quantification of several MNRI measurements. Results were expressed as proportion between fat volumes vs. total mouse volume (fat vol/total vol). G: eWAT weight in 3- and 9-month-old male Wt and GRK2+/− mice. H: Paraffin-embedded sections of WAT: retroperitoneal, epididymal, and inguinal fat pads from 9-month-old male Wt and GRK2+/− mice stained with hematoxylin and eosin. (Magnification ×10; scale bar 50 μm for all pictures.) Relative adipocyte size was calculated as in Fig. 6D. Data are means ± SEM of 5–30 animals per group. *P < 0.01. (A high-quality color representation of this figure is available in the online issue.)

