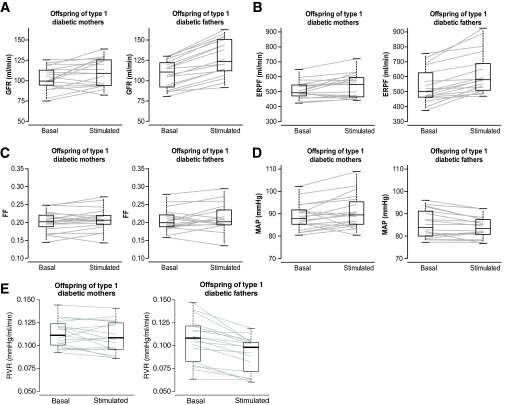
FIG. 1.
Kidney function of offspring of type 1 diabetic mothers (case subjects, left) and of offspring of type 1 diabetic fathers (control subjects, right) in basal conditions and during infusion of amino acids (stimulated). Data are given as median values with box plots and individual values. A: Changes in glomerular filtration rate (GFR), intragroup changes in case subjects: 8 ± 13%, P = 0.019, and in control subjects: 19 ± 17%, P = 0.002, intergroup comparison: P = 0.009. B: Changes in effective renal plasma flow (ERPF), intragroup changes in case subjects: 5 ± 9%, P = 0.016, and in control subjects: 16 ± 11%, P = 0.002, intergroup comparison: P = 0.0035. C: Changes in FF, intragroup changes in case subjects: 3 ± 8%, P = 0.14, and in control subjects: 3 ± 8%, P = 0.26, intergroup comparisons: P = 0.92. D: Changes in mean arterial pressure (MAP), intragroup changes in case subjects: 2 ± 5%, P = 0.061, and in control subjects: −2 ± 3%, P = 0.029, intergroup comparison: P = 0.019. E: Changes in renal vascular resistances (RVR), intragroup changes in case subjects: −3 ± 9%, P = 0.1, and in control subjects: −14 ± 8%, P = 0.002, intergroup comparison: P = 0.001.

