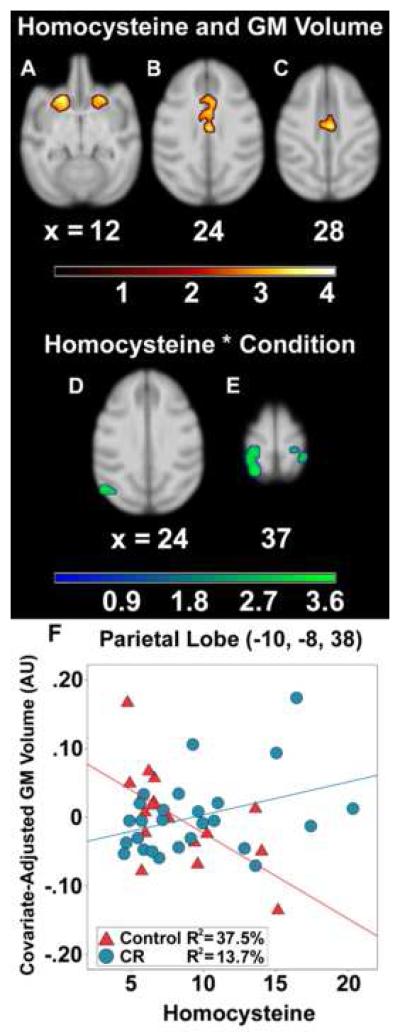
Figure 2.
Main effect association of Hcy and Hcy*Condition interaction on regional gray matter volume in neurological space. Hcy was correlated with lower gray matter in: bilateral striatum (A); anterior cingulate cortex (B); and mid cingulate cortex (C). The interaction tested where CR monkeys, per μmol/L unit increase in Hcy, showed a reduced relationship between Hcy and lower gray matter relative to controls. Regions implicated in the interaction after statistical correction included visual cortices (D), parietal areas (E), and right hippocampus (not shown). A representative voxel in left parietal lobe illustrates the interaction (F). The ‘warm’ and ‘green-blue’ color bars represent t-values for the association and interaction analyses respectively. gray matter volume is depicted in arbitrary units (AU).

