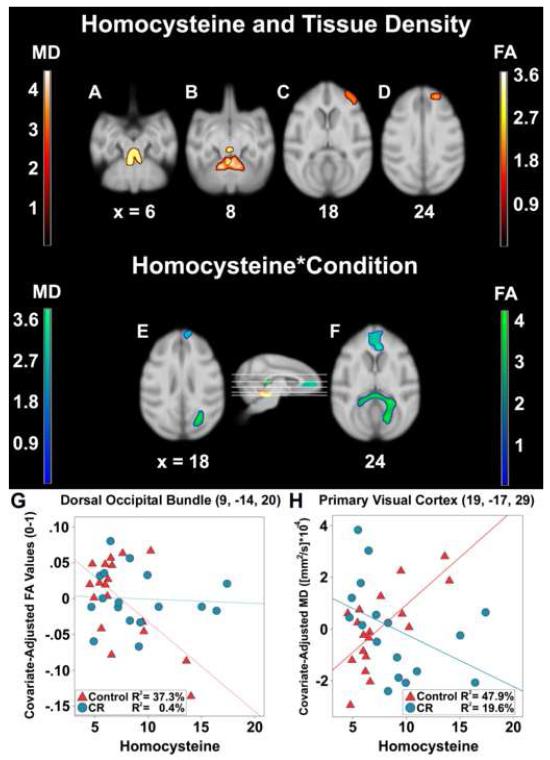
Figure 3.
Correlation of Hcy concentrations and the Hcy*Condition interaction with fractional anisotropy and mean diffusivity values in neurological space. The ‘orange’ and yellow’ t-statistic color maps respectively represent areas where greater Hcy levels were associated with higher mean diffusivity and lower fractional anisotropy. Hcy was correlated with lower fractional anisotropy in middle cerebellar peduncle (A). Higher mean diffusivity was seen in anterior cerebellum and the same peduncle (B); orbital and ventral prefrontal cortices (C); dorsal prefrontal cortex gray matter and corticocortical fibers (D). For the interaction, the ‘green’ (fractional anisotropy) and ‘blue’ (mean diffusivity) color maps show where CR monkeys had a mitigated correlation between Hcy and tissue density per μmol/L unit increase relative to controls. Regions implicated included the visual cortices (E) and medial prefrontal cortex within the cingulate sulcus (F). Representative voxels in dorsal occipital bundle (G) and primary visual cortex (H) illustrate the interaction for changes in fractional anisotropy and mean diffusivity.

