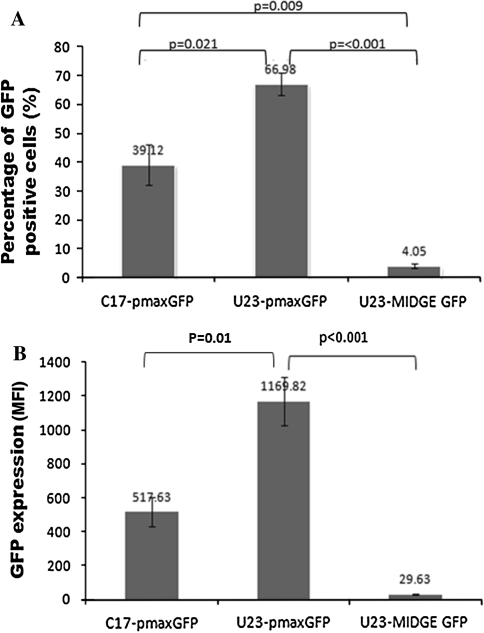
Fig. 6.
Nucleofection efficiency of plasmid and MIDGE into hMSC using different pulsing programs (C-17 or U-23). A Both GFP-encoding plasmid and MIDGE were nucleofected into hMSC. The bars show the percentage of viable cells expressing GFP as determined by flow cytometry. B Fluorescence intensities (MFI—Median Fluorescence Intensity) exhibited by the nucleofected cells. Each bar represents data from six independent experiments

