
Figure 2.
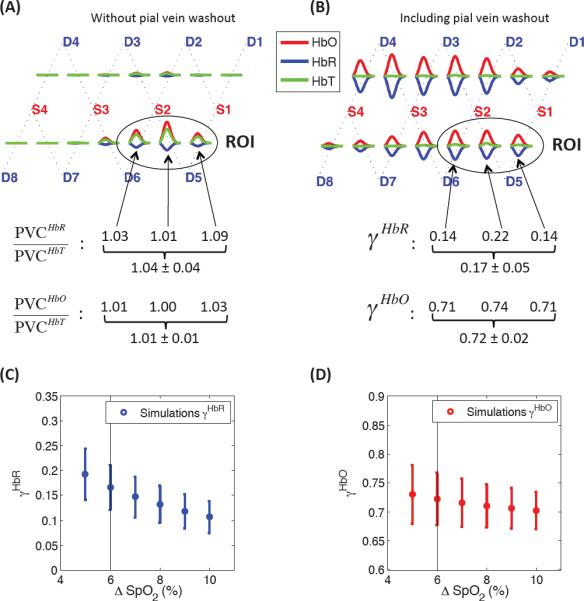
Results of the Monte Carlo simulations performed on the numerical volume shown in Fig. 1. (A) Simulation of a cortical activation with no pial vein washout (γHbR = 1 and γHbO = 1) to define the ROI and verify that PVCHbR = PVCHbT and PVCHbO = PVCHbT. (B) Simulation of a pial veins oxygenation increase of 6 % (60 to 66%) on top of a cortical activation. No volume changes were simulated in the pial veins (γHbT = 1). (C–D) Sensitivity analysis showing (C) the γHbR and (D) the γHbO values recovered by simulating an oxygenation increase of 5 to 10 %.