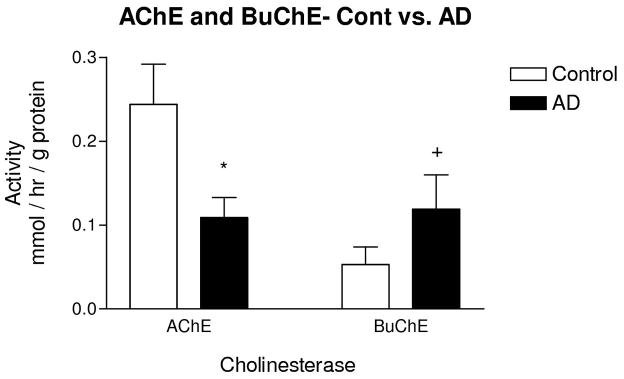
Figure 2.
Activity of ChEs in AD cortex. AChE activity was significantly lower in AD cases when compared with controls. BuChE activity was higher in AD when compared with controls, but the difference only approached significance. Bars represent mean activity ± standard error of the mean. AChE and BuChE activity in temporal and frontal cortex were averaged and used as data points for each case. * p<0.009, + p=0.086.

