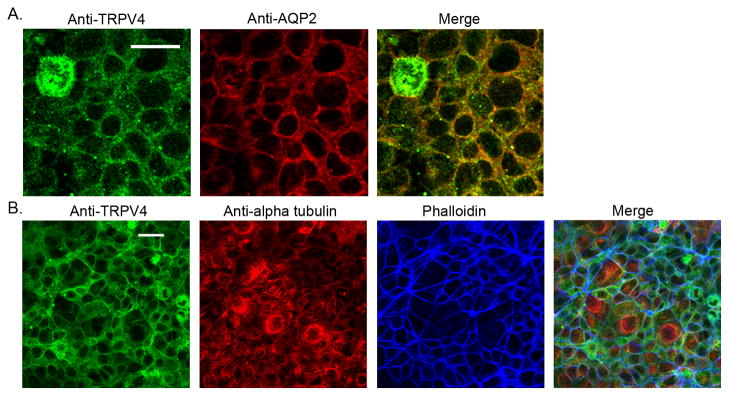
Figure 1.
Immunofluorescent imaging and immunostaining of M-1 cells. A. Immunofluorescent staining of M-1 cells for TRPV4 (Anti-TRPV4, green) and AQP-2 (Anti-aquaporin 2, red). Merged images (right panel) show significant co-localization of TRPV4 and AQP-2 proteins within the cytoplasm and at, or near, the plasma membrane. Scale bar = 20 μm. B. Immunofluorescent staining of M-1 cells for TRPV4 (Anti-TRPV4, green), α-tubulin (Anti-alpha tubulin, red), and F-actin (Phalloidin, blue). F-actin staining shows well-organized actin cortical bands near the periphery of the cell while α-tubule shows little defined organization. Co-localization of TRPV4 with actin is apparent near the cell membrane as apparent in the Merged image. Scale bar = 20 μm.

