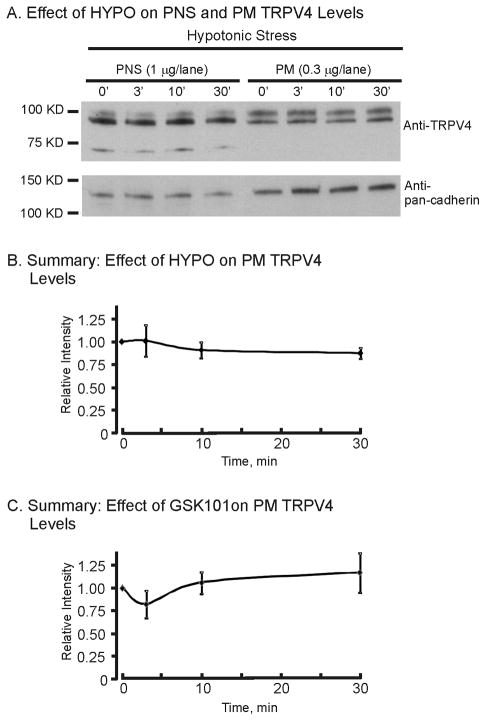
Figure 3.
Effect of HYPO and GSK101 on plasma membrane (PM) expression of TRPV4 in M-1 cells. A. Western blot of TRPV4 expression in the post-nuclear fraction (PNS, whole cell) and plasma membrane fraction (PM) following HYPO exposure over a 30-minute time period. B. Time course of the relative TRPV4 expression abundance (TRPV4/pan cadherin) following HYPO exposure. Values are normalized to the isotonic, control (ISO), condition (0 min) (n = 3). HYPO stimulation of TRPV4 did not lead to alterations in net TRPV4 expression levels at the plasma membrane. C. Time course of the relative TRPV4 expression levels (TRPV4/pan cadherin) following GSK101 (10 nM) exposure. Values are normalized to the control condition (0 min) (n = 3). GSK101 stimulation of TRPV4 did not lead to alterations in net TRPV4 expression levels at the plasma membrane.

